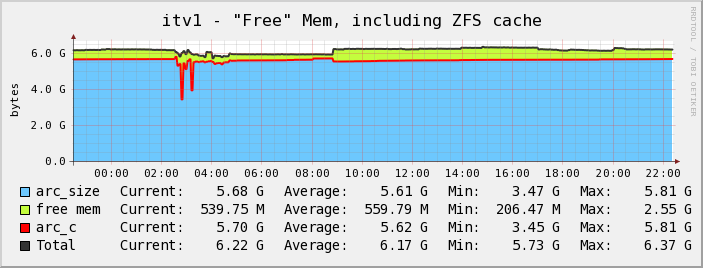
At ITVerkstan we use Cacti to graph and monitor all kinds of values on our Solaris servers. When setting up Cacti we wanted to create a graph to show the memory usage. This proved to be much harder to implement than I could first foresee.
We also use the almighty ZFS to have customers reside on their own separate file systems. This solution has gives us an extremely flexible, reliable and secure way to handle several customers on the same servers.
The problem when trying to monitor memory usage on a Solaris system with active ZFS file systems comes from Arc (Adaptive replacement cache). Arc is the ZFS memory caching system. Arc default behavior is to use all available memory except 1 Gb. This makes tools such as top and wmstat report that most of the memory is used but in reality it’s available for applications to use. Arc will return memory when applications need it.
None of the graph templates I found for memory on Solaris could give me an honest view of the usage.
I therefore created my own graph and included the Arc values.

The input values to the graph was made availabe to Cacti by SNMP. Three scripts was added to the server and then assigned their own OIDs in /etc/sma/snmp/snmpd.conf:
exec .1.3.6.1.4.1.2021.2789.51 zfs /bin/bash /local/admin/sbin/zfs_arc_cache

exec .1.3.6.1.4.1.2021.2789.52 free_mem /bin/bash /local/admin/sbin/free_mem

exec .1.3.6.1.4.1.2021.2789.53 zfs_size /bin/bash /local/admin/sbin/zfs_arc_cache_size
zfs_arc_cache:
#!/bin/bash

ZIO_BUF=$(kstat -p zfs:0:arcstats:c|awk '{print $NF}')

echo $ZIO_BUF
free_mem:
#!/bin/bash

FREE=$(($(pagesize)*$(kstat -p unix:0:system_pages:freemem|awk '{print $NF}')))

echo $FREE
zfs_arc_cache_size:
#!/bin/bash

ZIO_BUF=$(kstat -p zfs:0:arcstats:size|awk '{print $NF}')

echo $ZIO_BUF
After adding the scripts and restarting SMA the data input and graphs in Cacti needs to be defined.
Below you can download the ones we use. The xml file includes three data templates (one for each script) and one graph template.
Just download and use the Cacti import template function.
Templates for Cacti: cacti_graph_template_solaris_free_mem
Filed under: Cacti> Solaris Tags: by Mak Date 6 October, 2009
5 Comments »


